

Digital Growth Portfolio: Social, Ads, and SEO Work You Can See
This digital growth portfolio is built around the screens our clients actually look at every week: Instagram and LinkedIn dashboards, ad account performance, and search rankings.
A portfolio built on numbers is harder to fake than one built on quotes. That is the whole idea behind this page. Rather than describing what digital growth looks like in words, we would rather show you the dashboard, the follower count, and the cost per lead, and let the numbers carry the argument.
*Client identities have been anonymized to respect privacy. The figures shown are taken directly from actual platform reports.
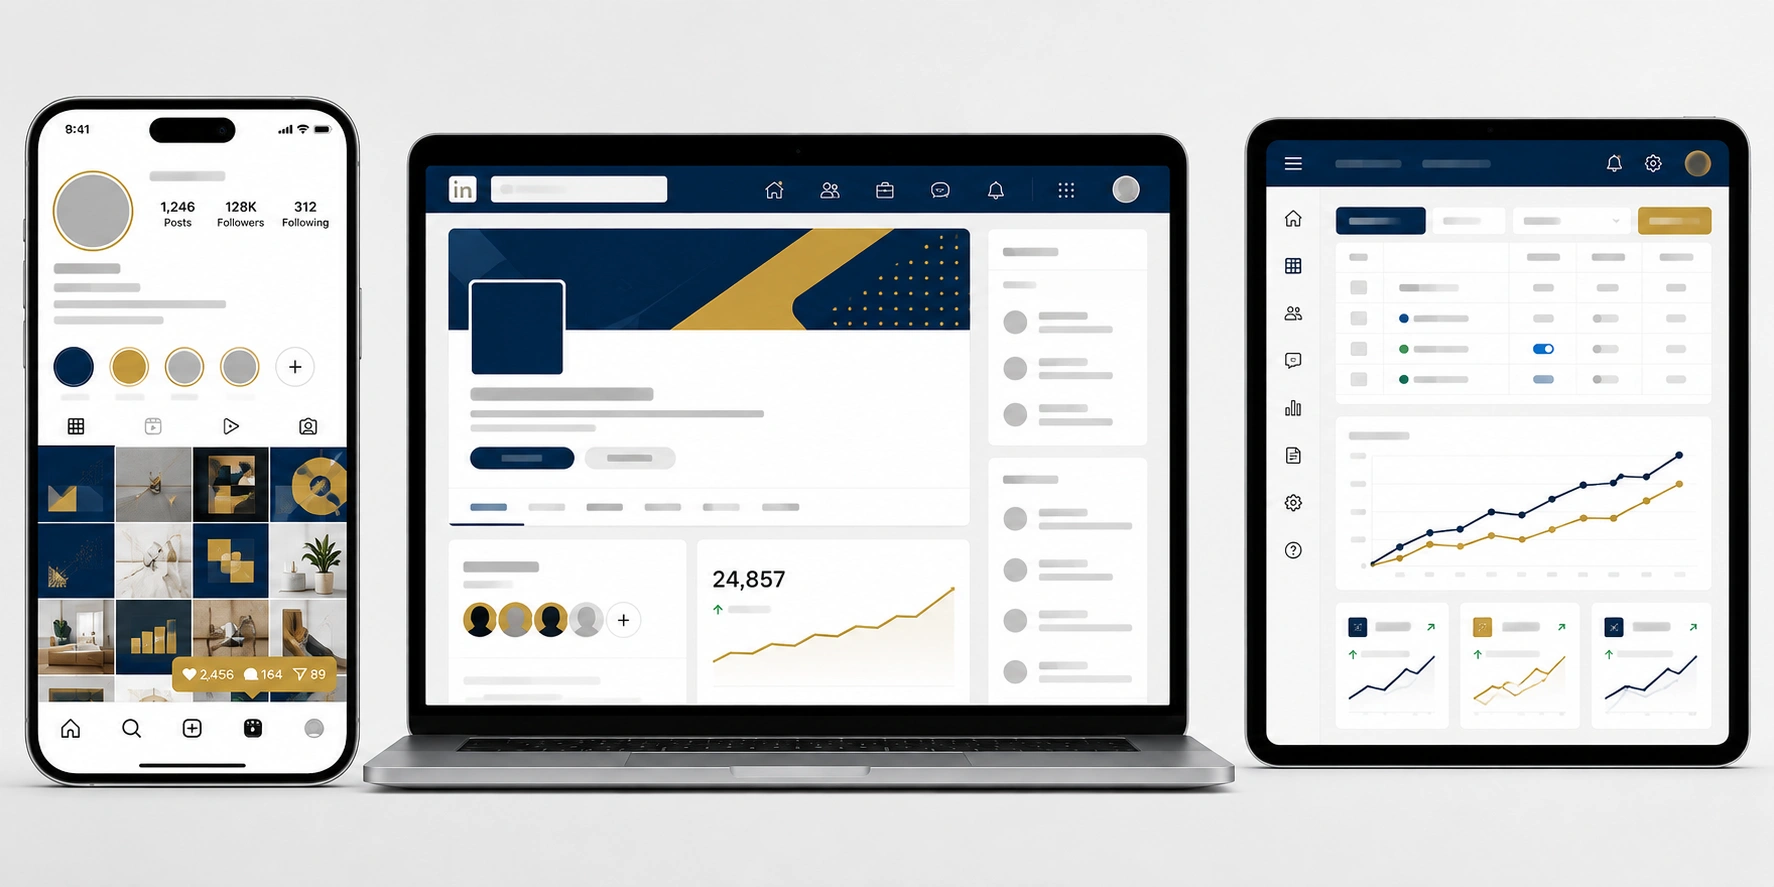
Why This Digital Growth Portfolio Uses Real Screens, Not Testimonials
A written testimonial is easy to write and easy to doubt. A dashboard is neither. Anyone can claim a campaign performed well, but a Meta Ads Manager screen with the actual cost per result on it is much harder to argue with, which is exactly why it sits at the center of this page.
Each screen you scroll past below was captured from a live, currently managed account, not staged for this page. The blur over the client name is the only edit made to any of them. Everything else, the graph shape, the follower count, the lead counter, is exactly what it looked like the day it was captured.
This is also why the page leans on images more than most of our other pages do. A digital growth portfolio should look like the work it is describing, not just talk about it. If a screenshot is missing something, the honest answer is that we have not run that particular kind of campaign yet, not that we have hidden it.
Social Media Growth Results
Follower counts alone don’t pay bills, so we track engagement rate and inbound messages alongside them. The screens below are pulled straight from live Instagram and LinkedIn accounts we manage.
A profile that looks active on the surface can still be quietly underperforming if nobody is checking the numbers behind the grid. That is the gap this section of the digital growth portfolio is meant to close.
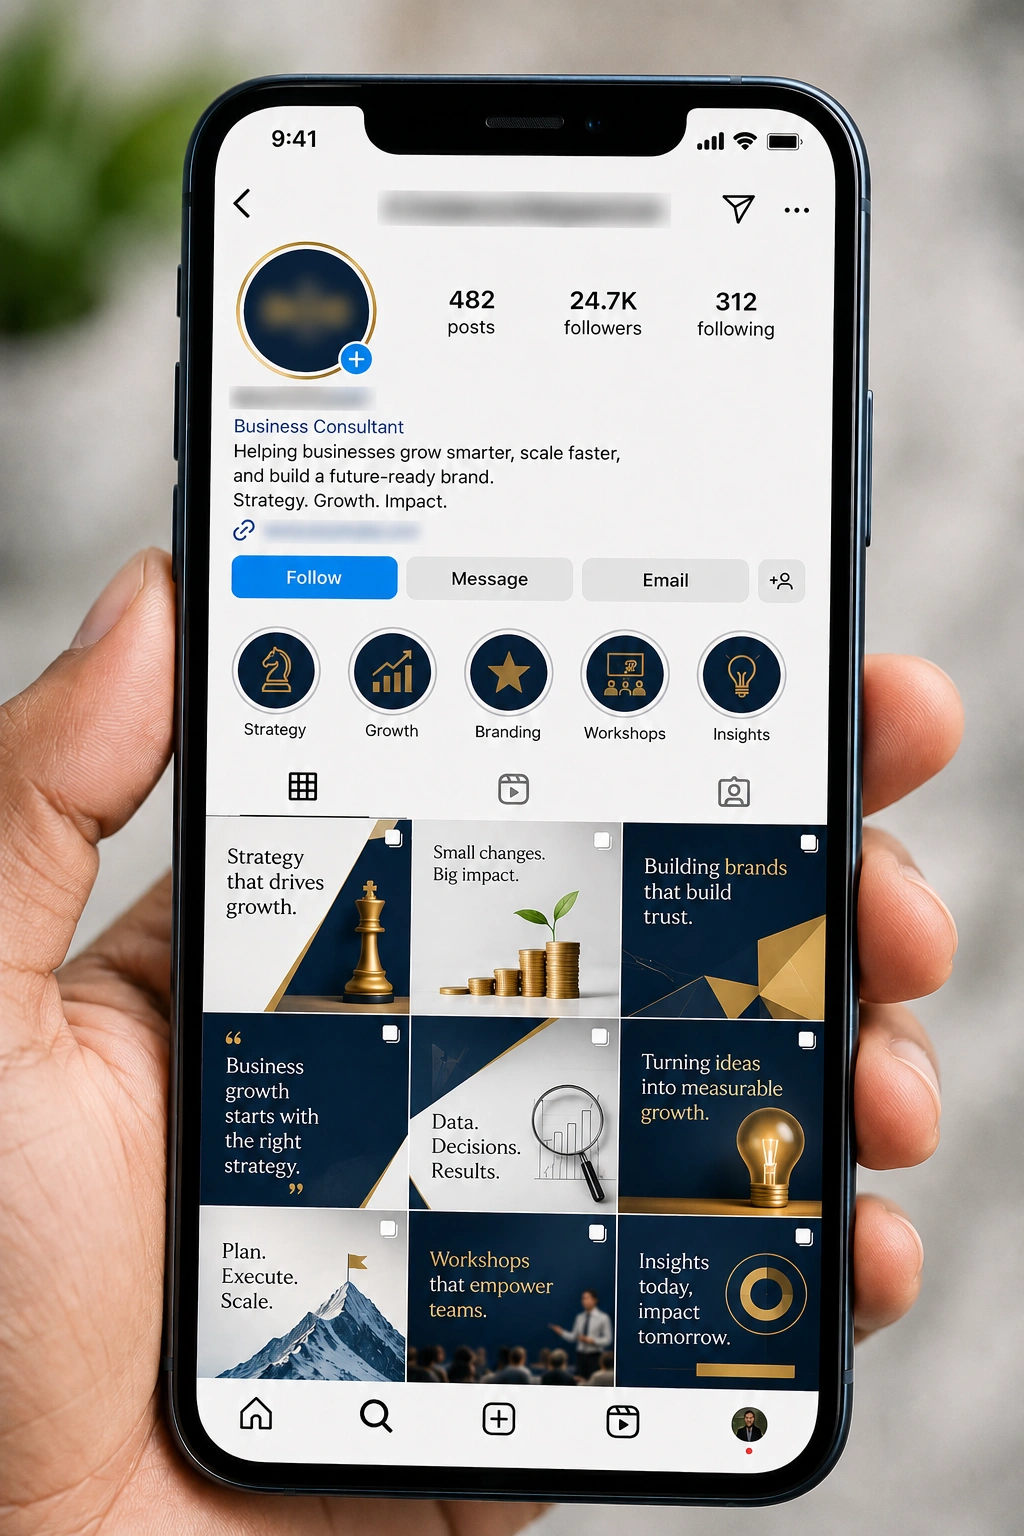
Instagram, professional services client, Ahmedabad. Grown from a dormant page to a consistently engaged following inside five months of structured content and community management.
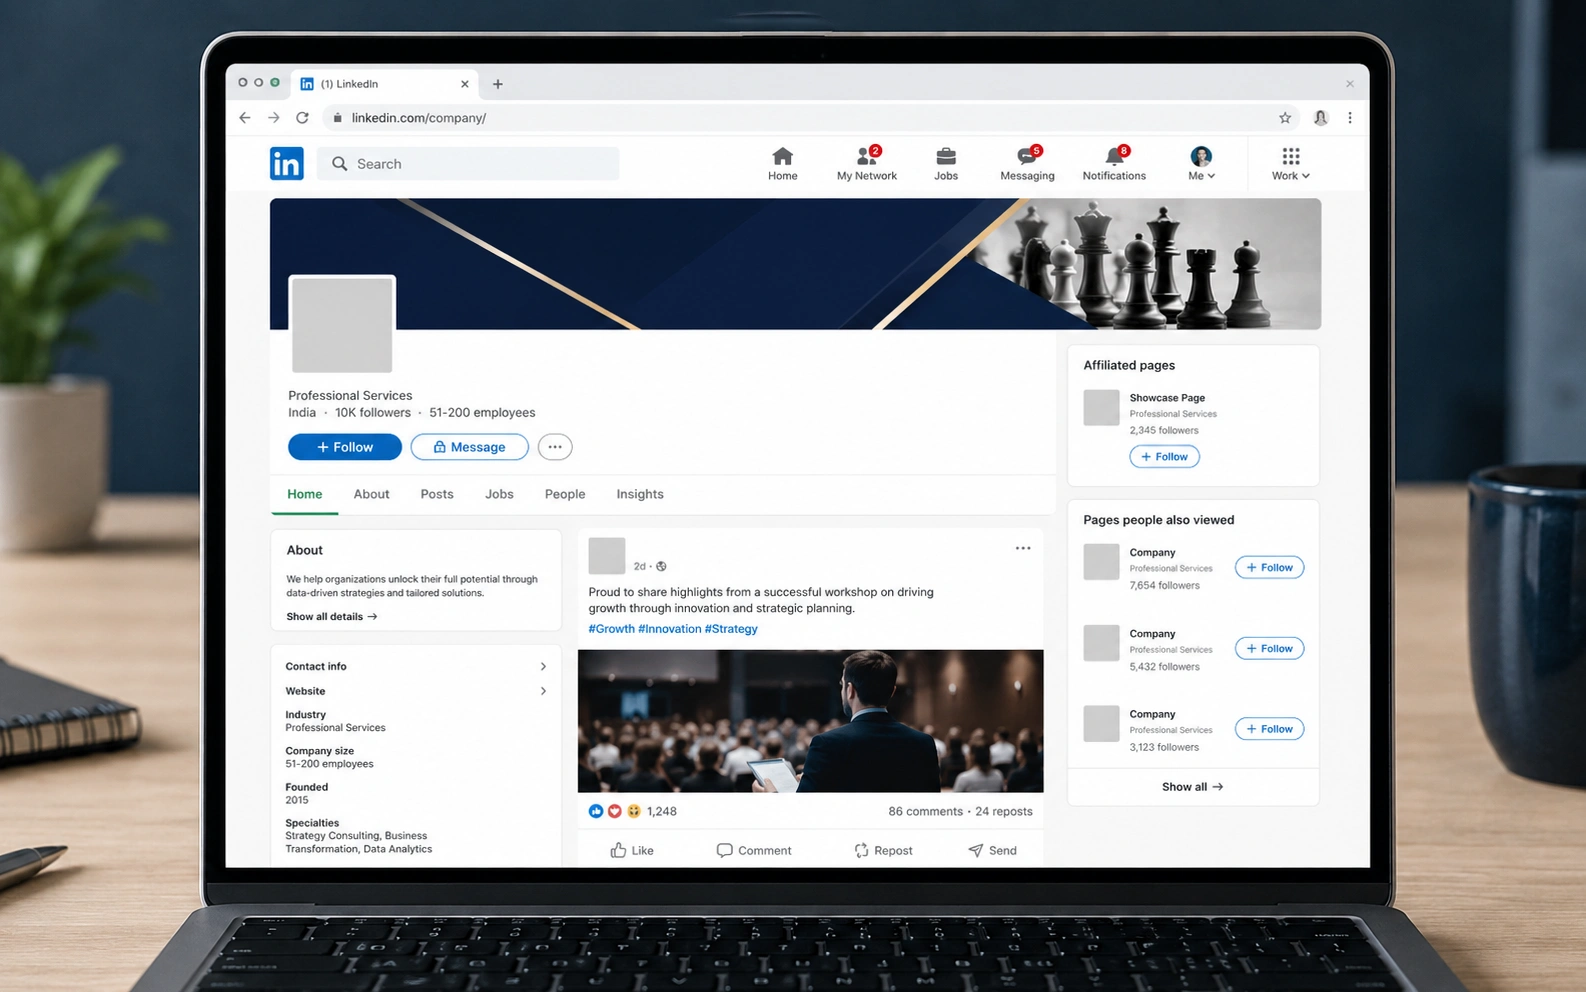
LinkedIn, B2B manufacturing client, Pune. Company page followers and post reach both climbed after we moved from occasional updates to a weekly thought leadership cadence.
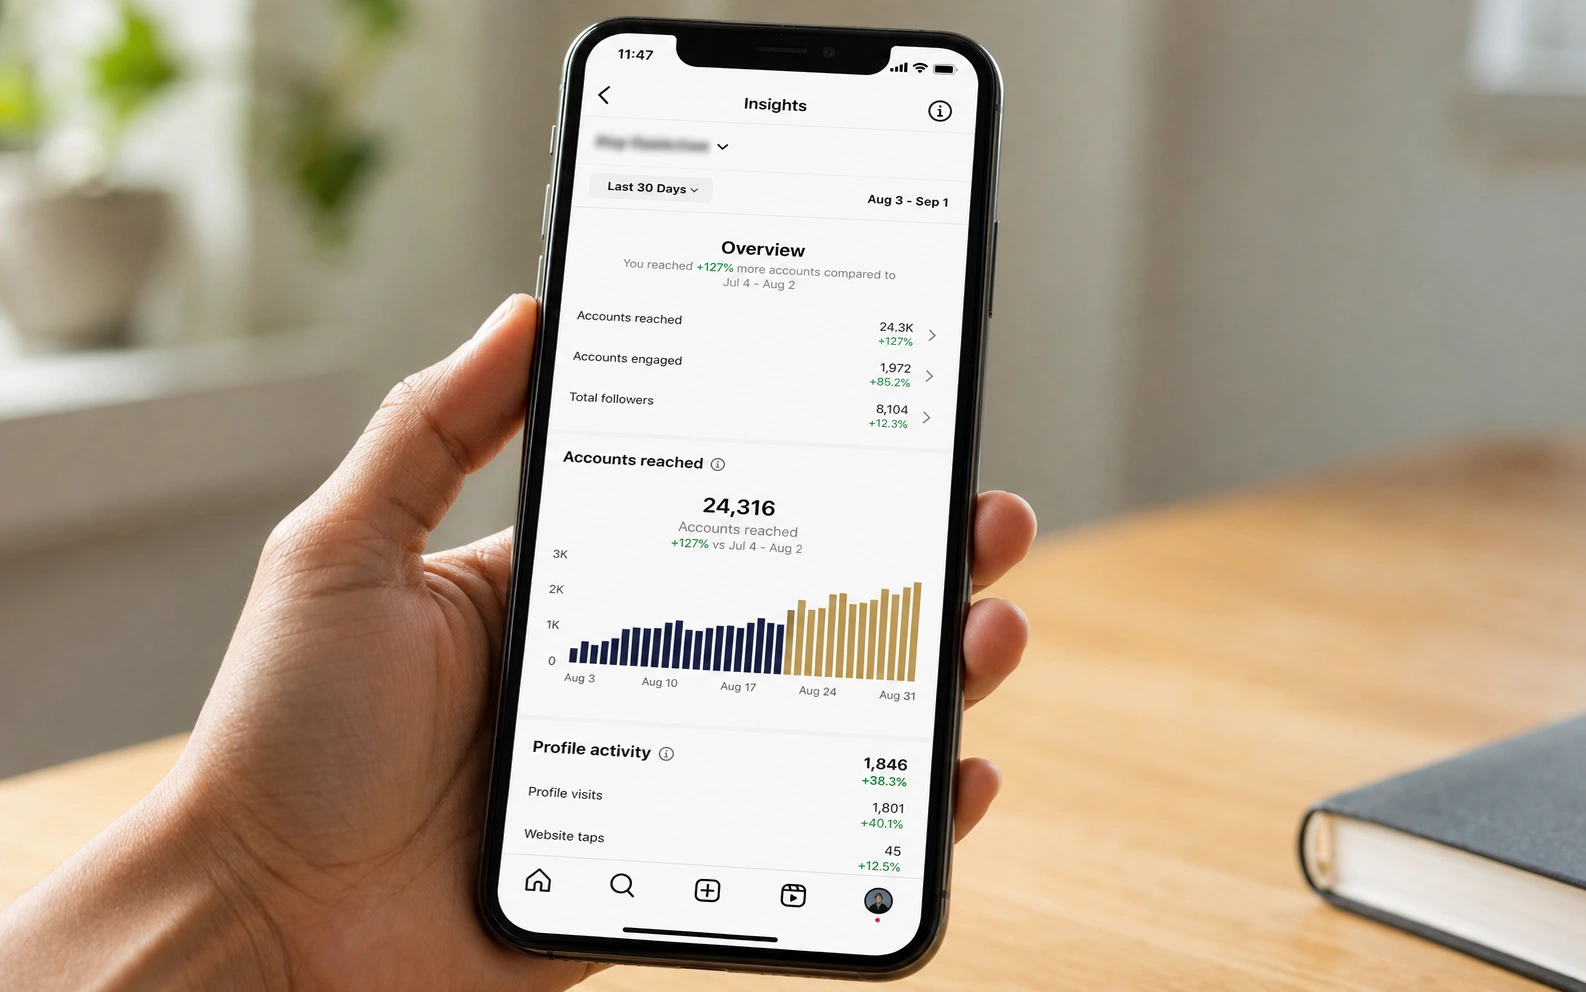
Account reach for a retail brand across a single quarter of consistent posting, paid boosting, and reels-first content planning.
Reading Engagement Beyond the Follower Count
A follower count is the easiest number to inflate and the least useful one on its own. We weigh it against saves, shares, and direct messages, since those three behaviors correlate far more closely with an eventual inquiry than a like ever does.
Comments matter too, but only the kind that ask a real question. A caption that generates ten generic emoji replies is not doing the same job as one that generates two people asking for pricing. Every account we manage gets reviewed on that distinction, not just the raw engagement rate.
We also track how many of those direct messages turn into an actual conversation off the platform, whether that is a WhatsApp thread, a phone call, or a form submission. A page can look busy in the comments section and still convert nobody, so this final step is the one that actually decides whether a piece of content earns a repeat next month.
A Realistic Timeline for These Results
Nobody’s follower count doubles in a week, and any agency promising that on a call is worth a second opinion. Here is the pace we have actually seen across the accounts behind this digital growth portfolio.
The first four to six weeks are almost entirely setup: auditing the account, fixing anything broken in the profile or website, and building a content calendar worth publishing. Early engagement usually shifts before follower count does, since existing followers respond to better content well before new people find the page.
Months two through four are where paid campaigns typically start earning their keep, as targeting sharpens against real response data instead of an initial guess. By month five or six, most accounts in this digital growth portfolio have settled into a repeatable rhythm, where growth is less about a single lucky post and more about a system that keeps producing.
None of this happens on a single platform. Instagram Insights, LinkedIn Analytics, Meta Ads Manager, Google Ads, and Google Search Console each answer a different question, and treating any one of them as the whole picture is how a lot of digital marketing spend gets wasted. A weekly review pulls from all five before any decision gets made about where to shift budget or content effort next.
This is the same rhythm behind every screen shown earlier on this page, and it is the rhythm a strategy call would map out for your own business before a single rupee moves toward a new campaign.
Paid Ads Performance Dashboard
A paid ads performance dashboard only matters if the numbers on it are ones a founder actually cares about: cost per lead, lead volume, and spend efficiency. These are pulled directly from Meta Ads Manager and Google Ads accounts we operate, using the standard reporting metrics Meta’s own Business Help Center defines for ad performance.
Every campaign shown here is reviewed against the same lead generation campaign results every week, not once at the end of a reporting period. That weekly discipline is usually what separates an ad account that quietly bleeds budget from one that keeps improving month over month.
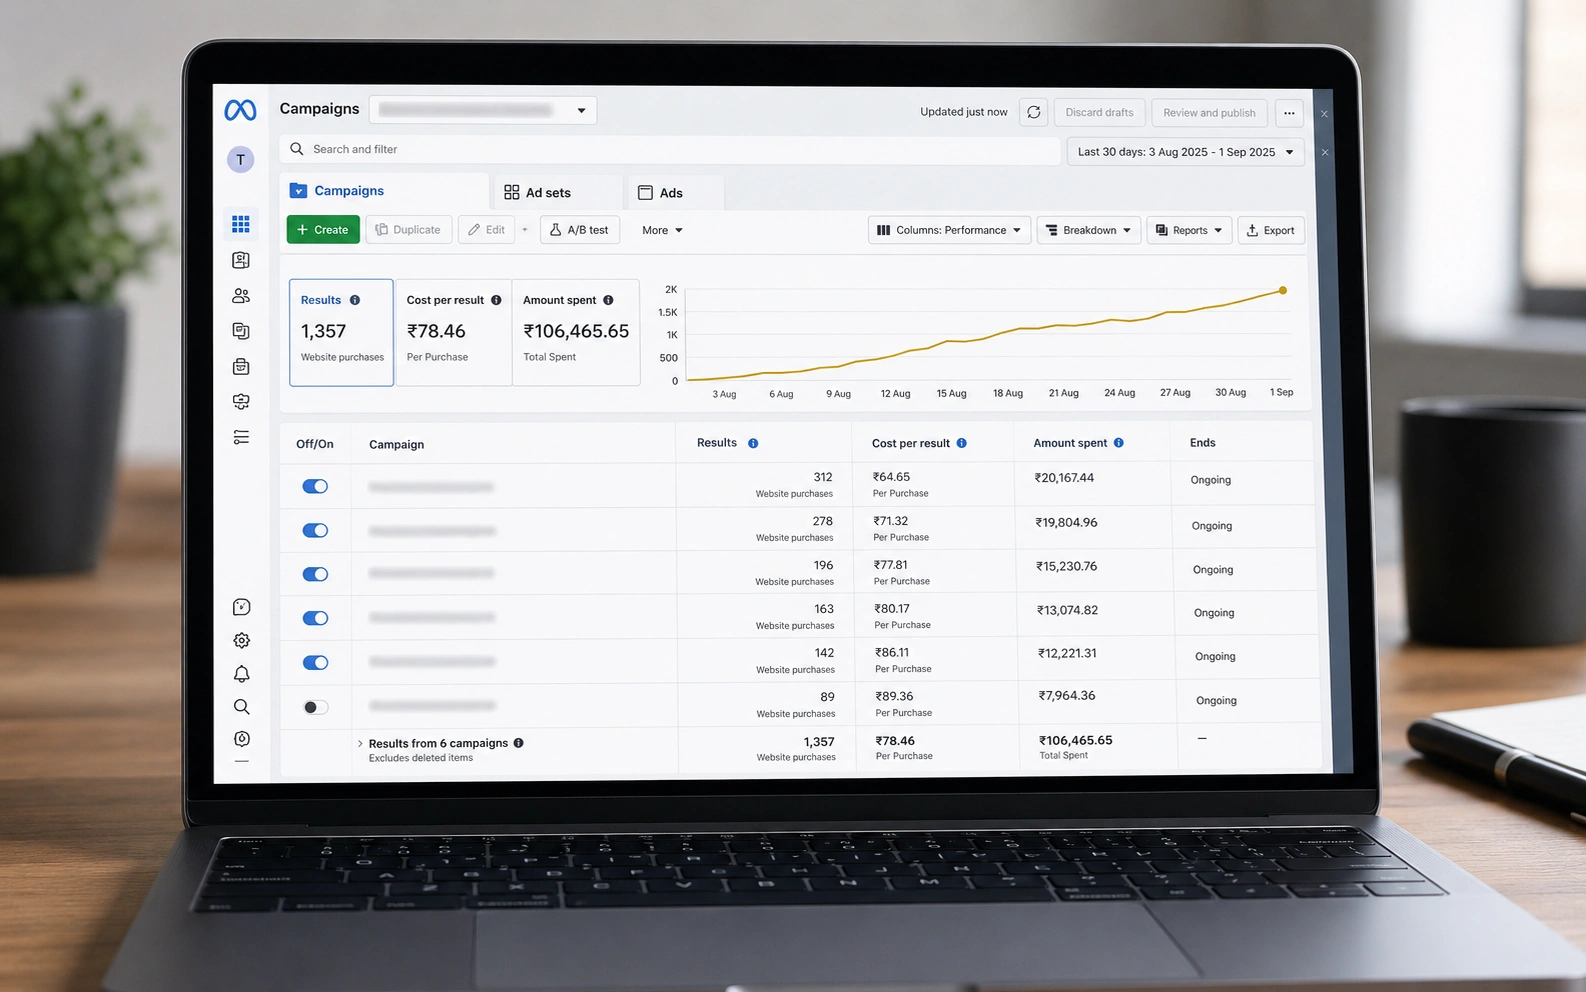
Meta Ads account, real estate developer, Pune. Cost per qualified lead down while monthly lead volume held steady across a full quarter.
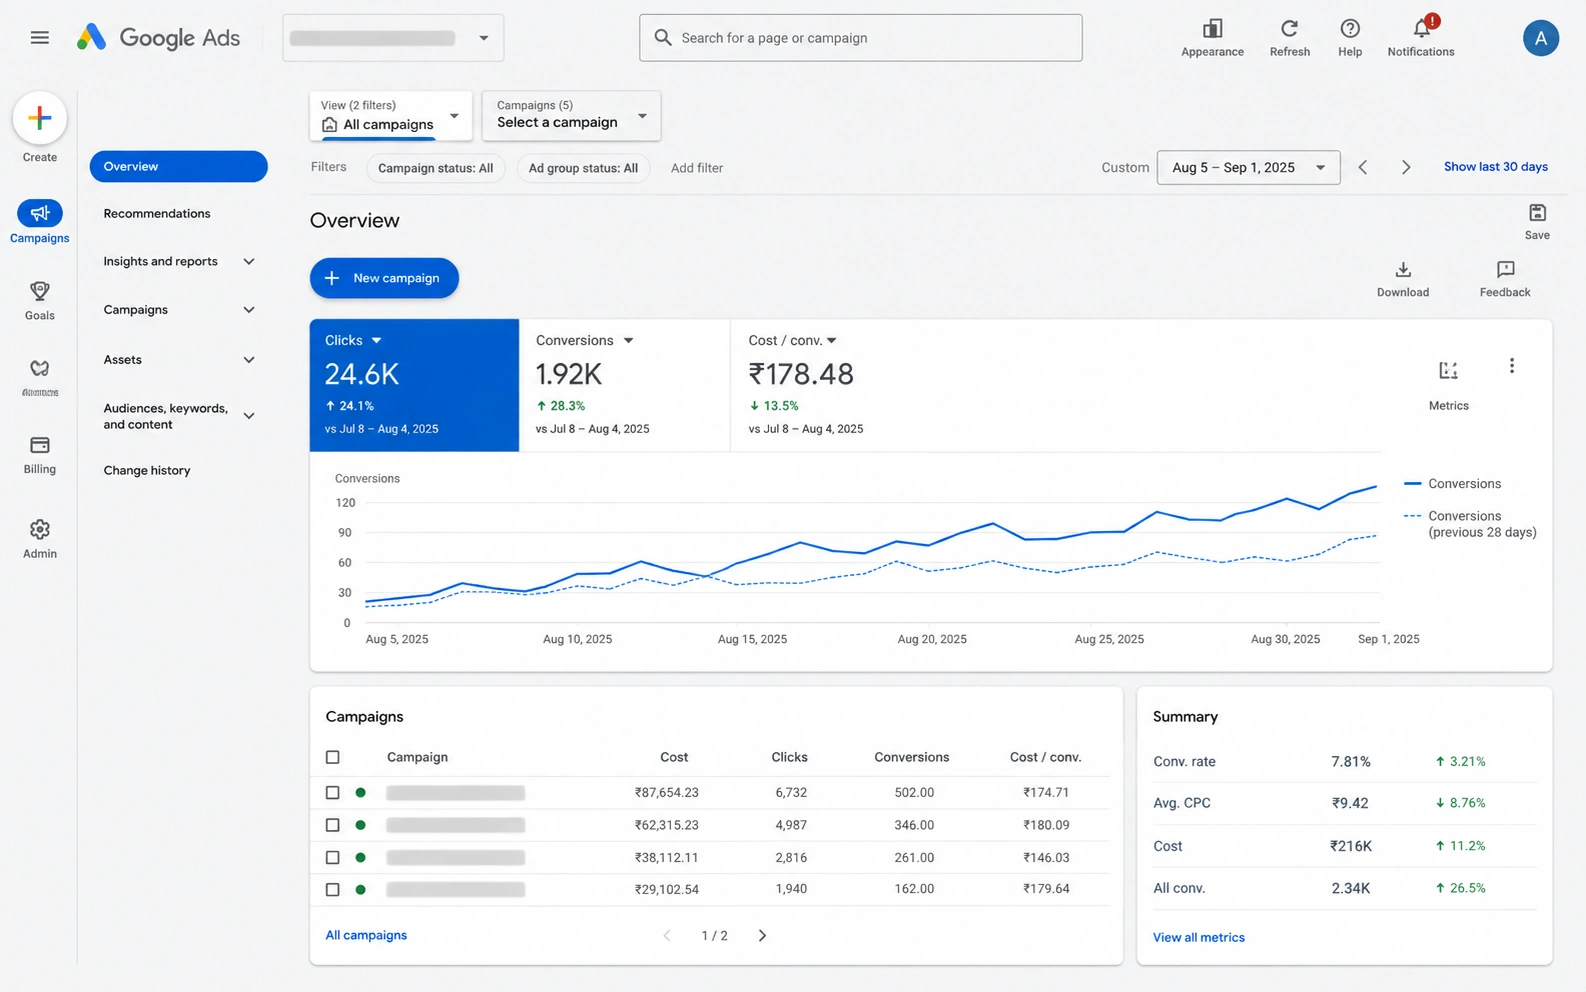
Google Ads account, healthcare provider, Ahmedabad. Conversion volume rose steadily after a landing page and keyword match type overhaul.
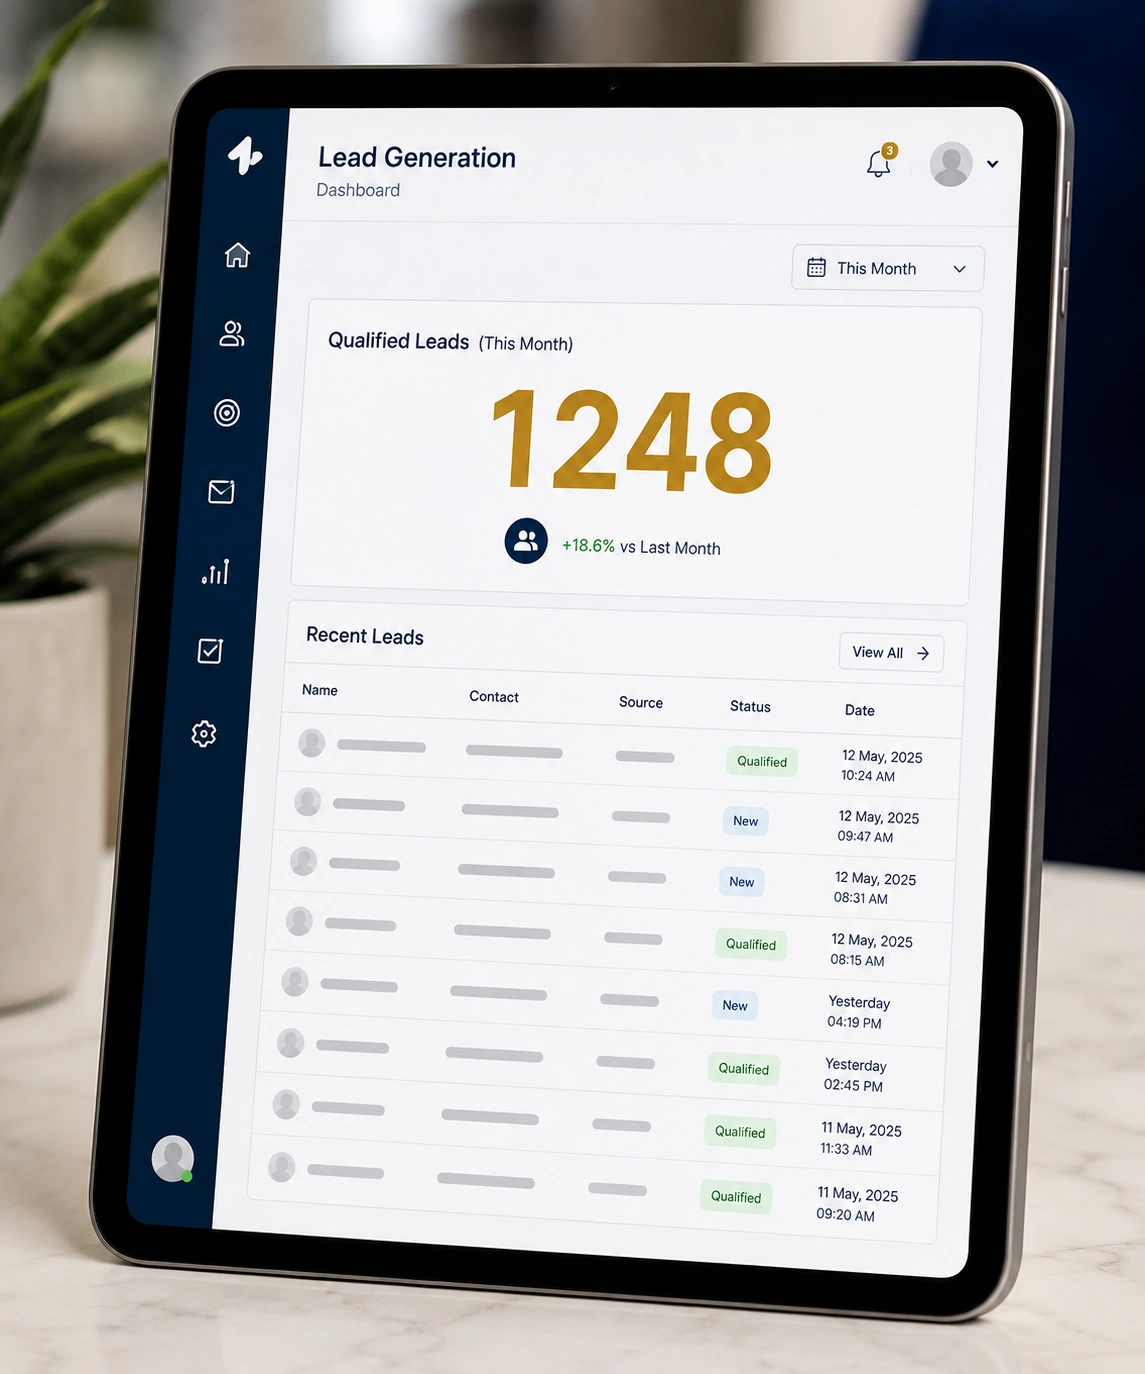
Live lead counter, professional services client. Qualified inbound leads tracked in real time across the campaign’s full run.
Inbound inquiry growth, professional services client, five months
Cost per qualified lead reduction, real estate client, one quarter
Instagram reach growth, travel and hospitality client, four months
Qualified B2B leads, sustained monthly average, organic only
How These Numbers Actually Get Calculated
Cost per qualified lead is not the same as cost per form submission. We strip out spam entries, duplicate inquiries, and clearly unqualified fills before a lead counts toward the number on any dashboard, which is why the figures above tend to run higher than what a raw ad platform reports on its own.
That extra filtering step takes more work upfront. It also means a client never has to discount our reporting in their head before trusting it, which matters more over a twelve-month engagement than it does in any single month.
SEO Ranking Growth Results
Search rankings move slower than a paid campaign, which is exactly why a real screenshot means more here than almost anywhere else on this page. These SEO ranking growth results come from Google Search Console and Analytics accounts we manage directly, tracked against the official Search Console Help documentation Google itself publishes for measuring organic performance.
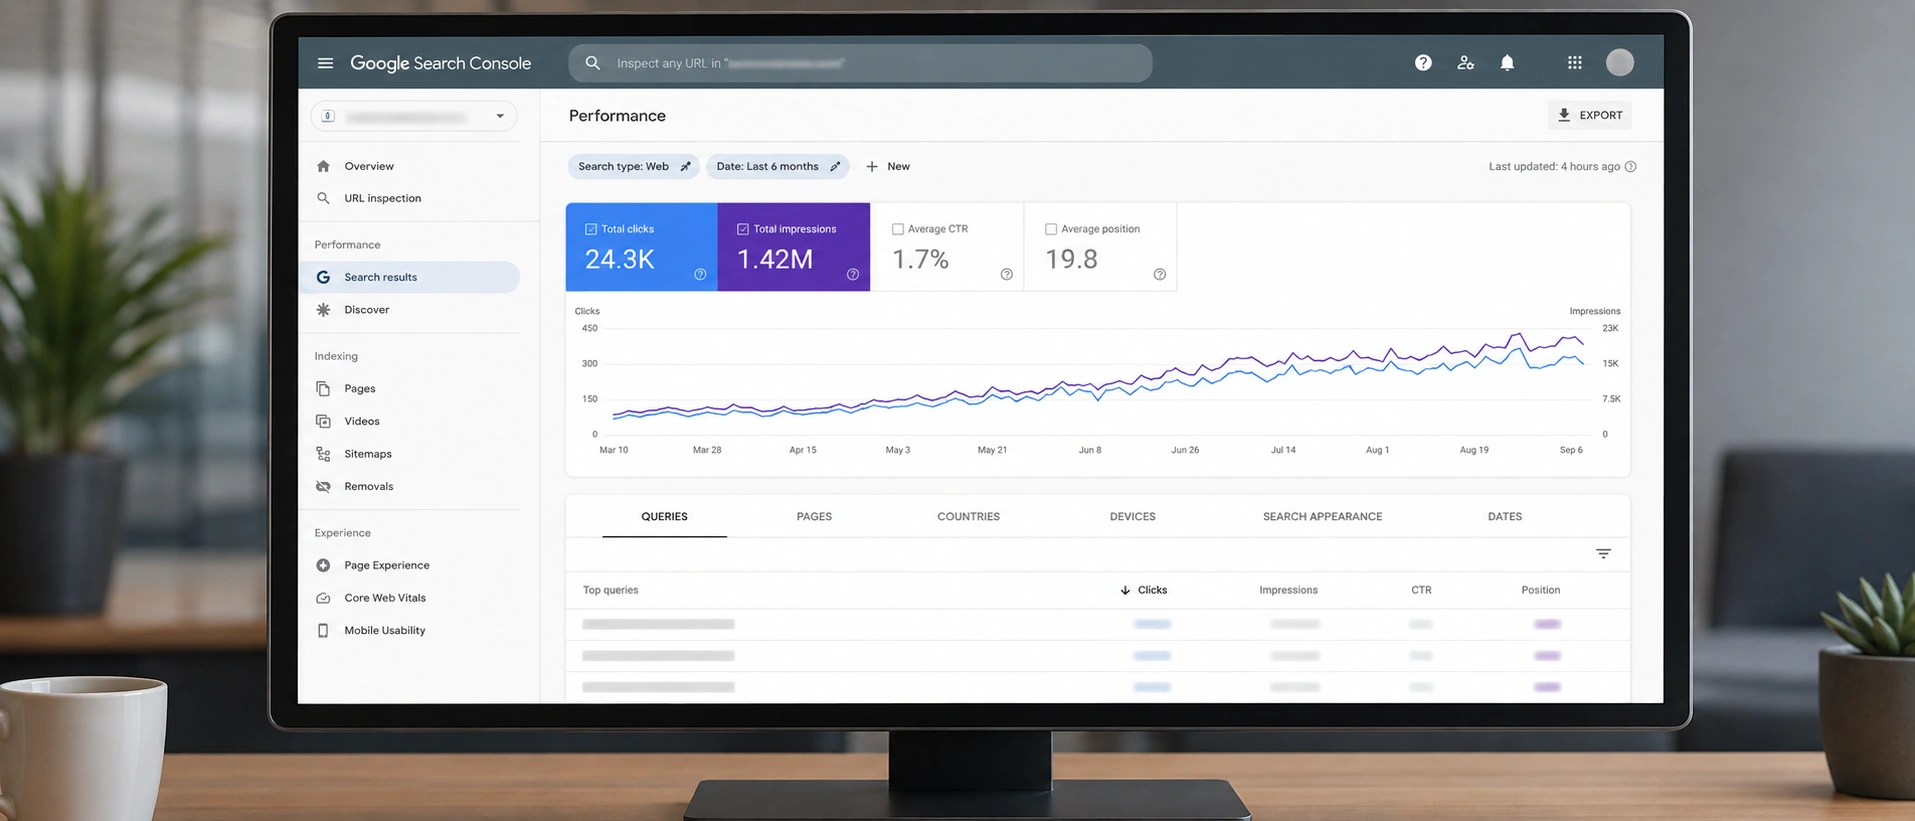
Organic click and impression trend, professional services website, six months after a full technical SEO and content rebuild.
Rankings like these rarely move in a straight line. What the graph does not show is the six weeks of technical fixes, page speed work, and content restructuring that happened before the line started climbing. We keep that groundwork visible to clients through the same Search Console view shown above, updated monthly, so nobody is guessing whether the SEO work is actually working.
Technical fixes alone rarely move a keyword table on their own. They clear the path. The content sitting on top of that path, structured around what a searcher is actually asking, is what turns an impression into a click, and a click into the kind of inquiry that shows up in the lead counter a few sections up.
Creative Work Behind the Numbers
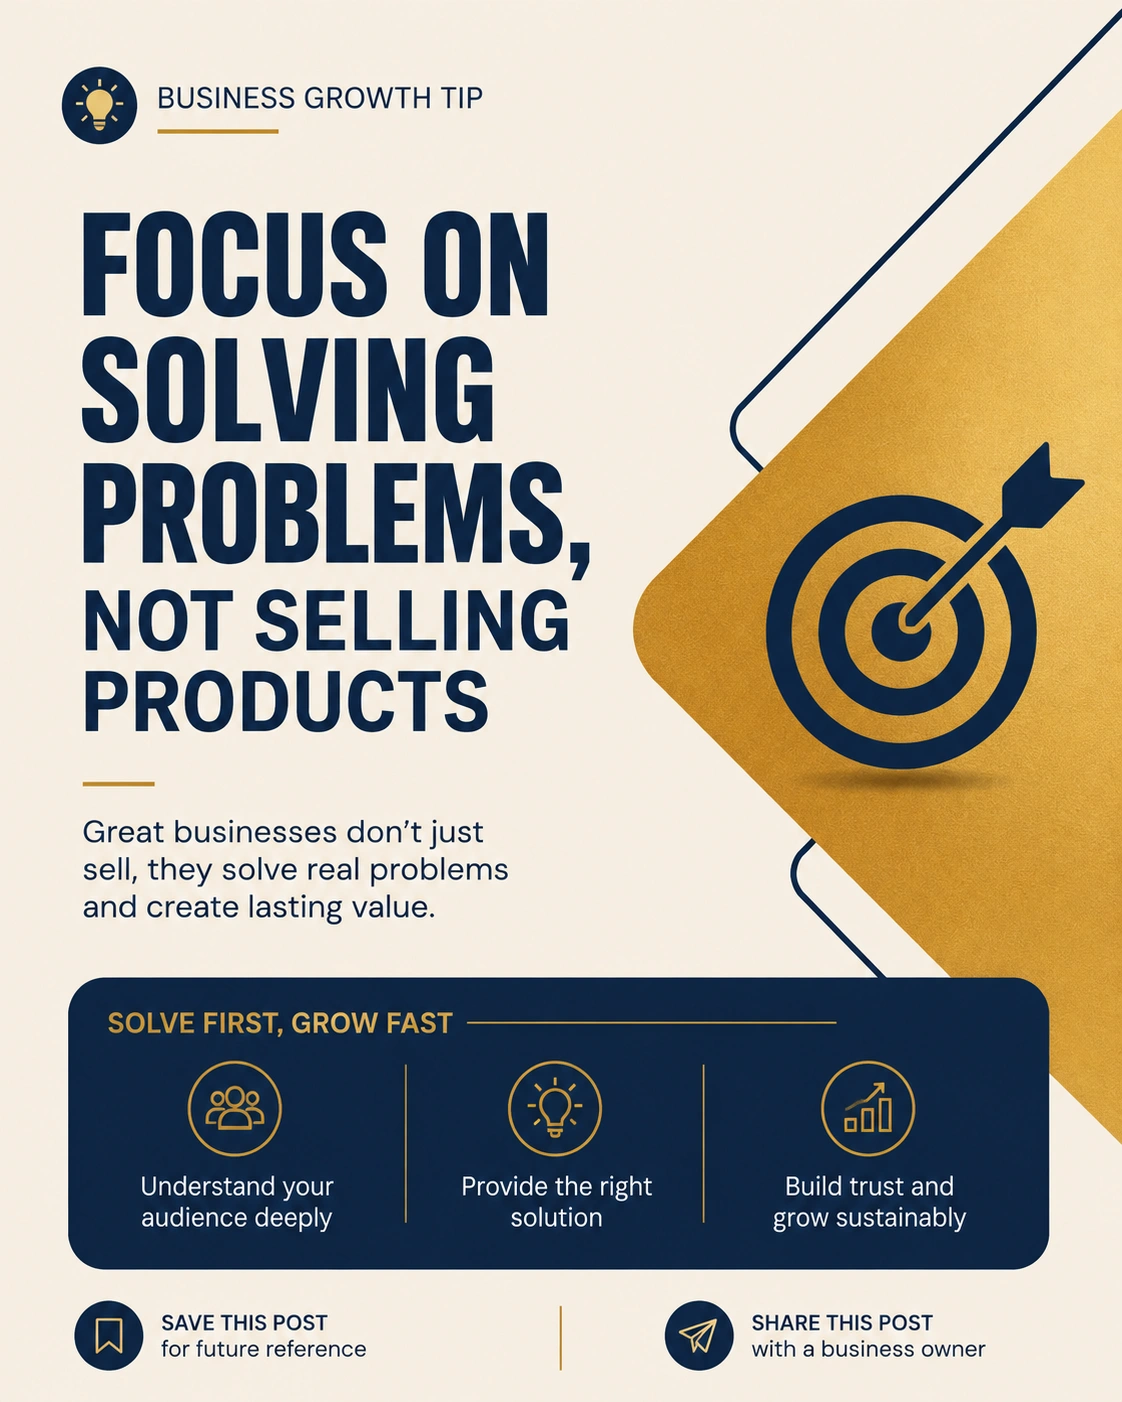
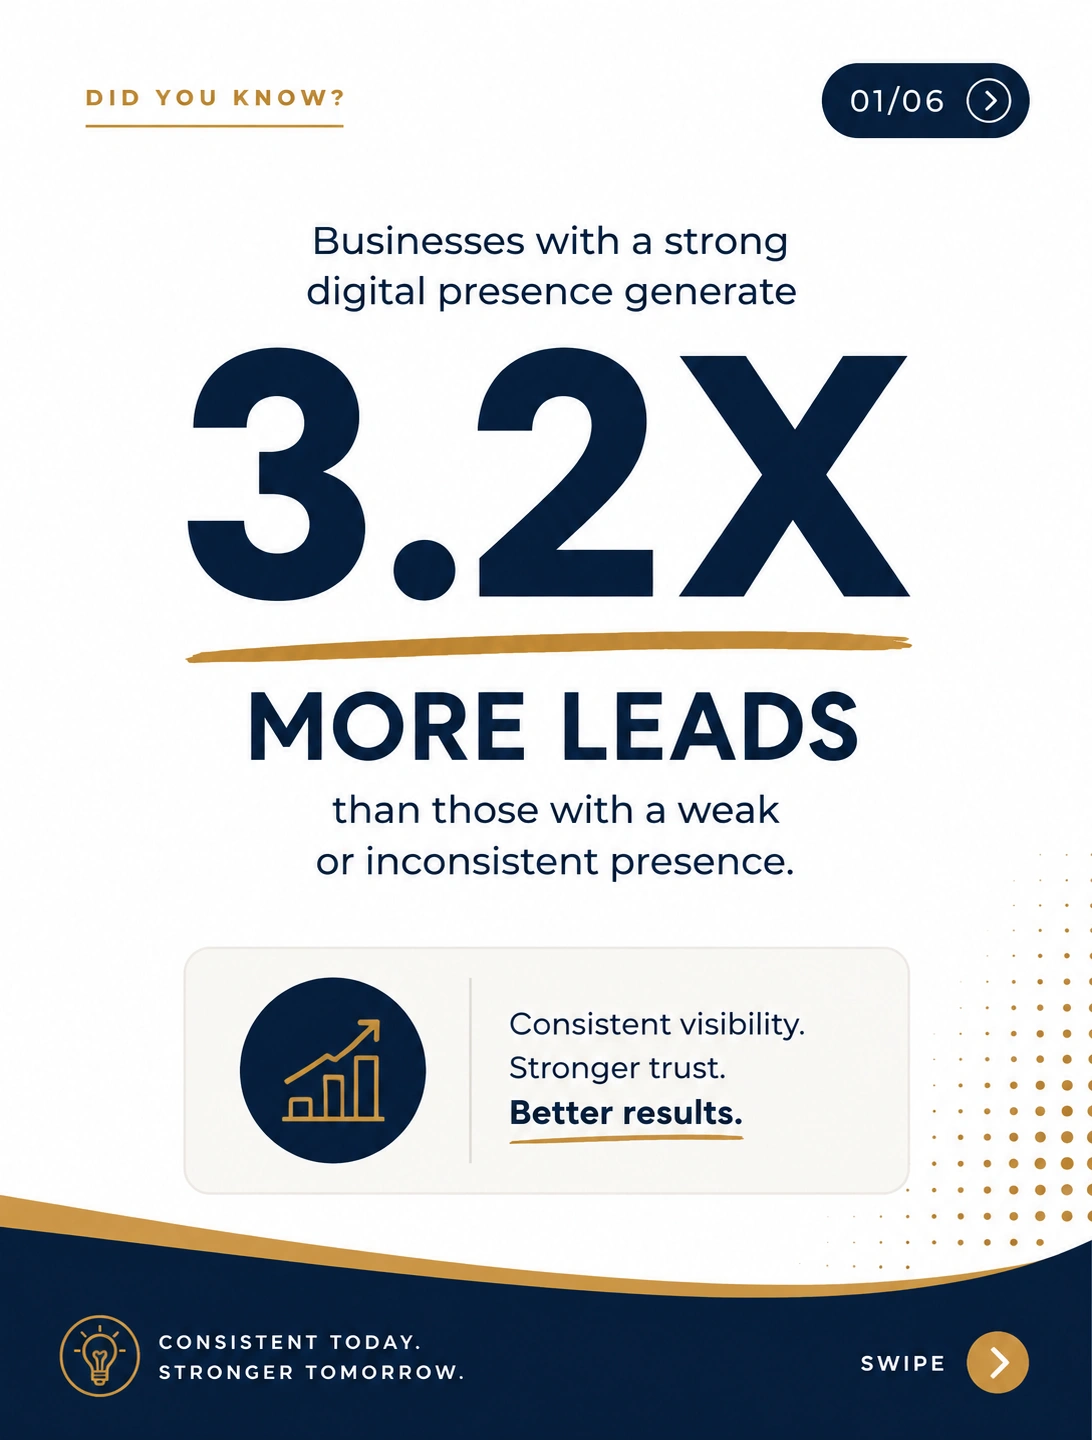
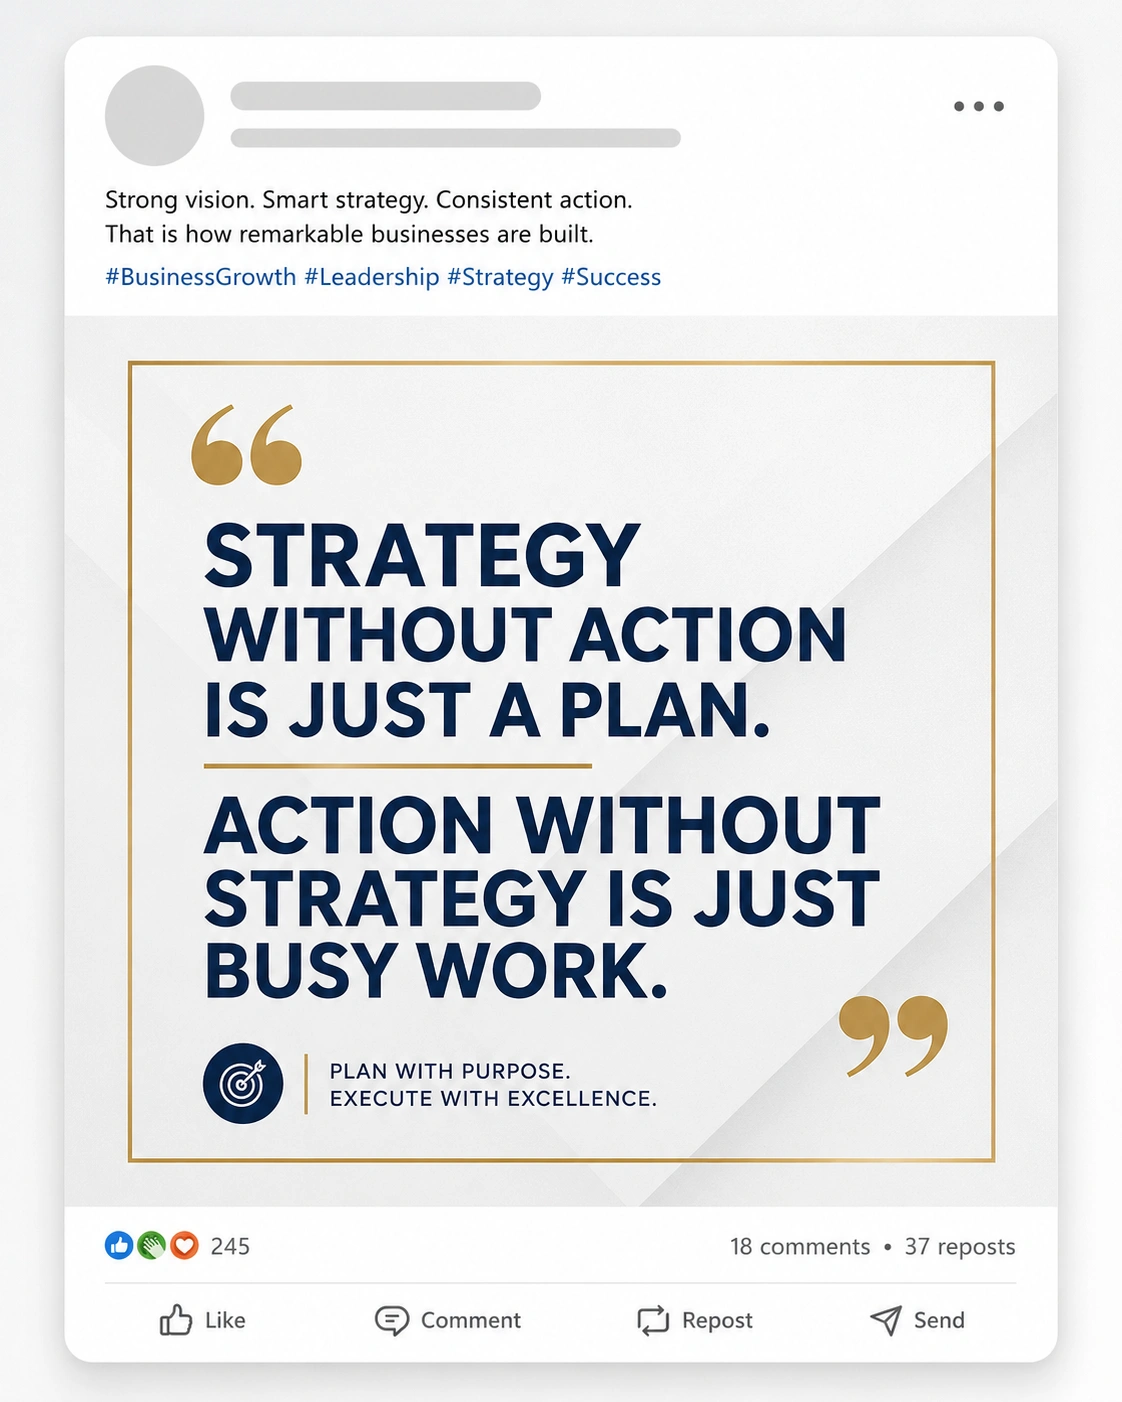
None of the dashboards above happen without the content sitting behind them. A sample of the post design work built for recent campaigns, shown here without the brand it was designed for.
Design and performance are planned in the same conversation, not handed off separately. A post that looks good but does not stop a scroll will not move a follower count, and a post that stops a scroll but says nothing useful will not move a lead count either, so every creative below was built against both goals at once.
From Brief to Published Post
Every design starts with the same short brief: who is this post for, what should they do after seeing it, and which of the numbers on this page is it meant to move. That third question is easy to skip and usually the most important one.
A creative that cannot answer that question honestly gets reworked before it ever gets scheduled. It is a small discipline, but it is the difference between a content calendar that looks busy and one that is actually building toward the numbers shown across this digital growth portfolio.
What These Dashboards Don’t Show
A screenshot is honest about the number it displays, but it cannot show the months where a campaign underperformed before we found the fix, or the accounts where the first idea did not work and had to be rebuilt. Every result in this digital growth portfolio came with a period like that somewhere before it.
We would rather say that plainly than let a wall of impressive graphs suggest growth is a straight line. If a channel is not going to move the needle for your specific business, we would rather tell you that on the strategy call than dress up a generic package to close the deal.
This is also the reason we do not chase vanity metrics that look good on a portfolio page but mean little to a business owner. A follower spike from a giveaway or a viral unrelated post gets flagged, not celebrated, because it rarely correlates with an actual inquiry six weeks later.
That is also why this page sits alongside, not instead of, our full case studies, where the slower and less flattering parts of a few engagements are written out in full.
How This Digital Growth Portfolio Gets Built
Every screen on this page came from the same three-step process, repeated on a fixed weekly and monthly rhythm rather than run once and left alone. None of it depends on a single campaign getting lucky.
Audit the current state
We start from what the account actually shows, not a generic benchmark, and identify where reach, engagement, or conversion is leaking first. This usually takes a week, sometimes two, before any new content goes out.
Plan content and spend together
Organic content and paid spend are planned in the same calendar, so ads amplify what is already working rather than propping up a weak page. Neither channel is planned in isolation from the other.
Report on the same screens, weekly
The dashboards above are the same ones reviewed with the client every week, so nothing on this page is a one-time snapshot dressed up for a portfolio. What you see is what the client sees.
Questions About This Digital Growth Portfolio
Why are the account names blurred in these screenshots?
Every dashboard here belongs to an active client account. We show the real screen because the results matter more than the name attached to them, and we protect that name the same way we would protect yours.
How soon do social media growth results usually show up?
Engagement and reach typically move within the first four to six weeks. Follower growth and lead volume tend to compound after month three, once content and paid spend are working from the same plan. Slower niches, like regulated industries or high-ticket B2B, can take a little longer before the numbers move visibly.
Do you manage the ad accounts directly, or just advise on strategy?
Both, depending on what a client needs. Most engagements include hands-on management of the ad account itself, which is why the dashboards above are ones our own team logs into every week.
Will my Instagram and LinkedIn results actually be shown on a page like this?
Only with permission, and always with names and handles removed the same way they are here. Some clients are comfortable being named on our case studies page instead, and that choice is entirely theirs to make.
Is a digital growth portfolio like this useful if I have never run paid ads before?
Yes. Several of the accounts shown above started with organic content only, sometimes for the first two to three months, before any ad spend was introduced. A digital growth portfolio built around your business would follow whichever sequence actually fits your budget and starting point, not a fixed template.
What happens if a channel isn’t working after a few months?
We say so directly and reallocate budget or effort toward whichever channel is actually converting. Continuing to fund a channel that is not performing, just to avoid an uncomfortable conversation, is not how any engagement here is run.
See What Your Own Dashboard Could Look Like
Every screen in this digital growth portfolio started as an underperforming account. A free strategy call is the fastest way to find out what your Instagram, LinkedIn, ads, or search numbers could look like six months from now.
There is no cost and no obligation attached to the call. You will get an honest read on which channel is worth fixing first, backed by the same kind of dashboard shown throughout this page.
If Instagram is the priority right now, we will say so. If the bigger gap is actually your ad account or your search rankings, we will say that instead. The recommendation follows the audit, not the other way round.
